This page shows an example how to find a potential trending product under $20. The first part of the example was done on september the 20th. To see what happens the days following we checked the product again on september the 20th. This gives an good indication what kind of sales you could have made if you would have used the product.
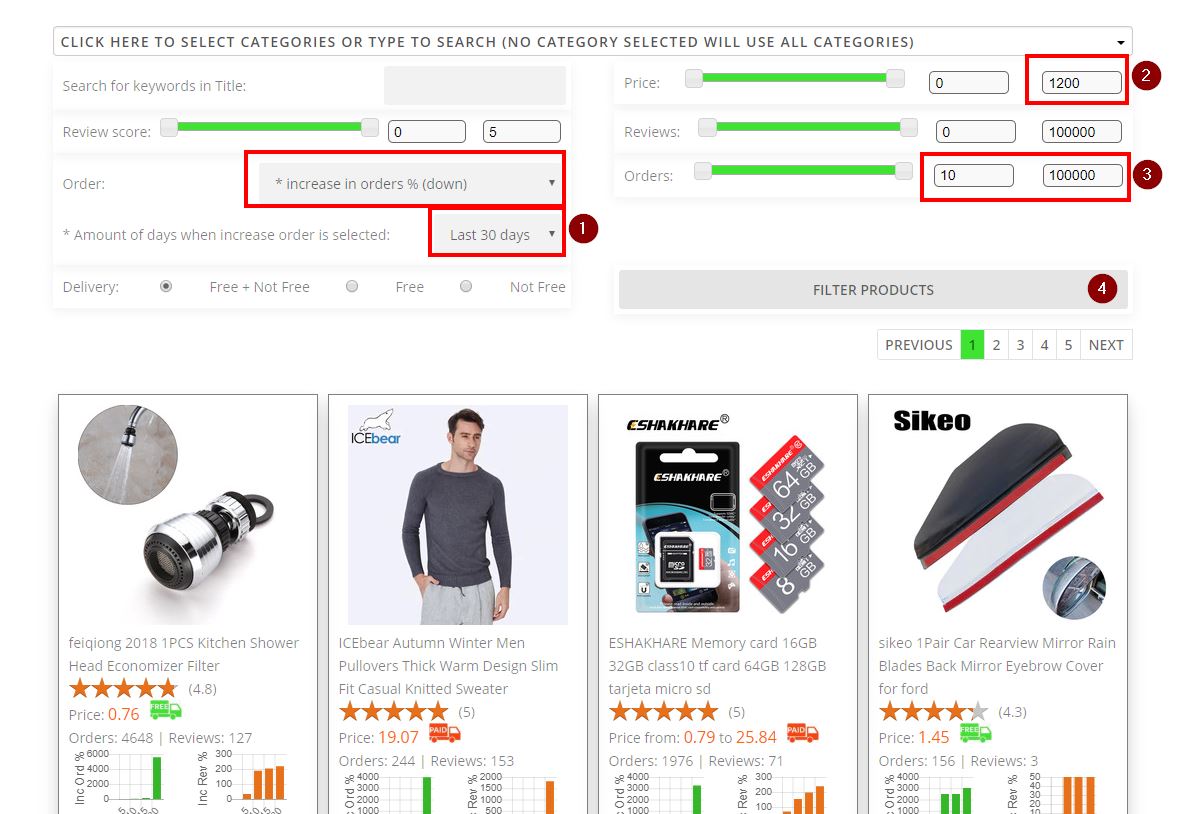
- Select “Increase in orders %(down) + Last 5 days. This will sort the products such that the first product is the product with the biggest increase in orders in the last 5 days.
- Set the max price to $20
- Set the orders to be between 100 and 1000 orders. As we want products that did sell during the last 5 days we want a minimum amount of orders above 100. But we do not want products that we know are sold in very large quantities, so we set the maimum to 1000.
- Click on “Filter products” to filter them with the selection.
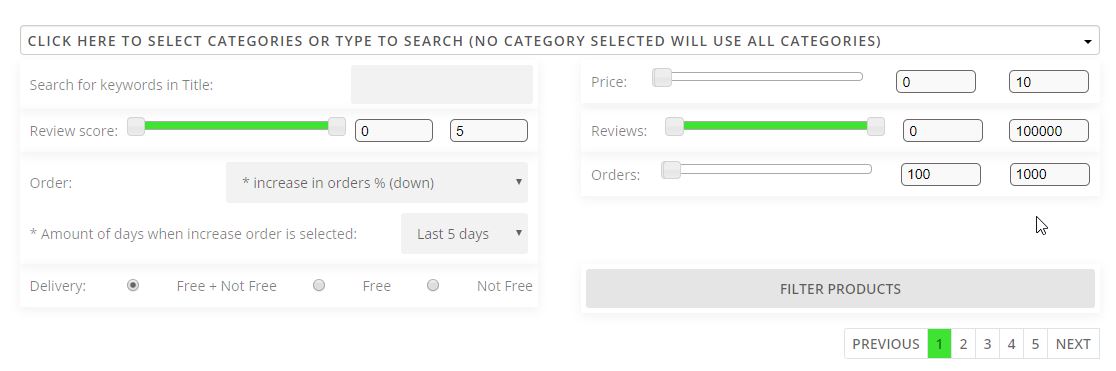
The filter now looks like this..
Find an interesting product in the list of products. For this example we choose a product that has seen more evenly spread growth over the last weeks.
The two small bar graphs show the increase in orders and reviews for the last 5, 10, 15 and 30 days. If the four bars are around the same height, it means that the increase in orders was in the last couple of days. If the bars are more looking like a stairs it means that the increase was more equal spread over the previous weeks.
Click on the buttons to show the product, show the shop that sells the product, show similar products and to show the details of the product.

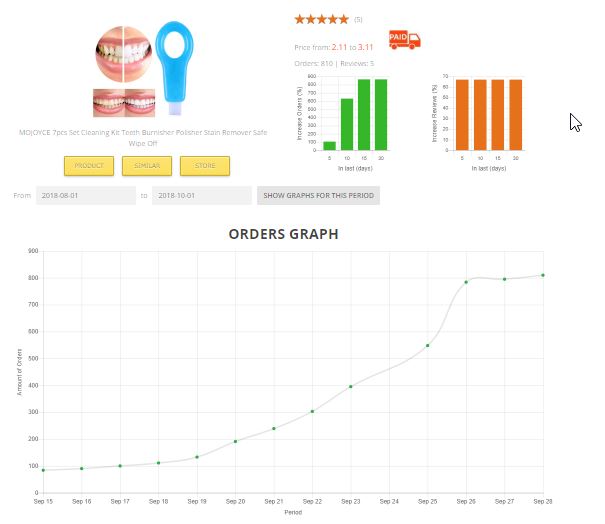
When clicked on “Details”, the details of the product are shown. It contains several graphs or orders, reviews and price.
The graph show how the product orders increase over the last several weeks.
The image shows how the graph would look like when the filter for 5 days would be used on september the 20th. At that time the order increase was more than 100%.

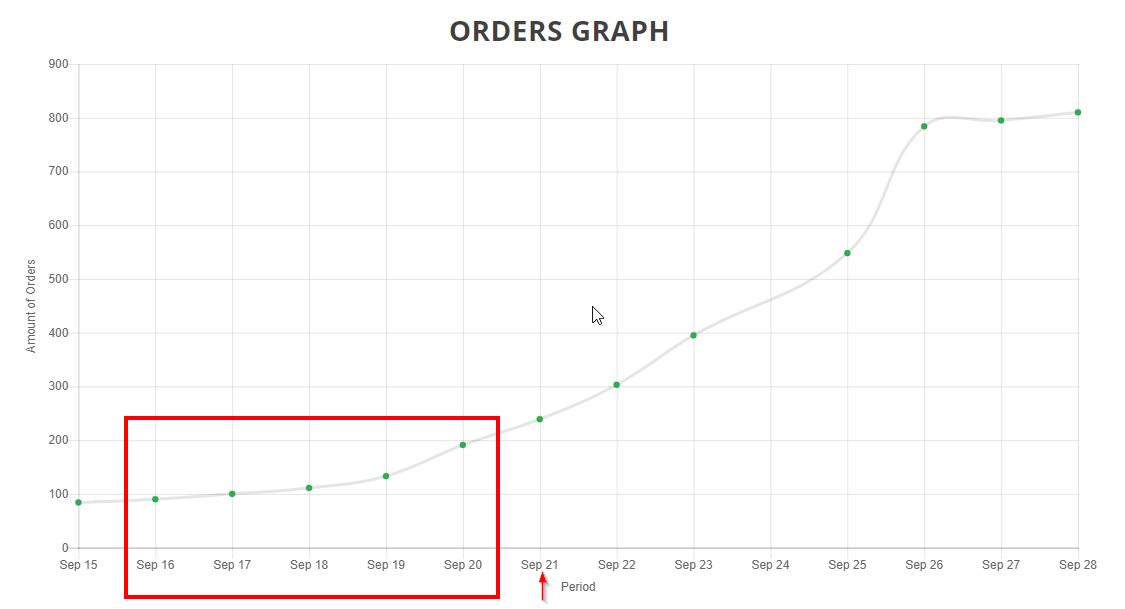
Several days later we can see that this product would have been a very good candidate and that is has seen a nice growth. We know that the product can be sold in larger quantities. Using New Product Spy you could have found this product and use it on your site. Of course further product research is always necessary after identifying a potential candidate.
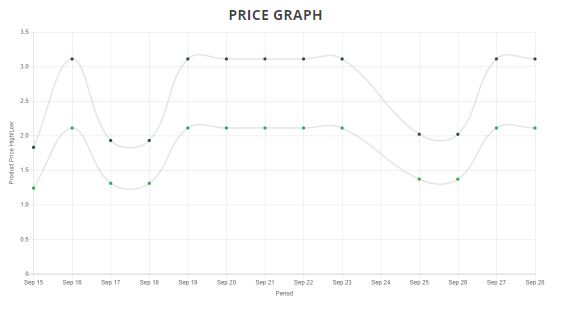
The price graph shows that the store selling the product made some changes over a period of 2 weeks. This can help to discuss the price if you sell larger quantities.